(Optional) Profiling Parallel Applications
Overview
Teaching: 0 min
Exercises: 0 minQuestions
It works, but what is taking time?
Objectives
Use a profiler to find bottlenecks and hotspots and diagnose problems.
| Display Language | ||
|---|---|---|
Benchmark before you optimize
“We should forget about small efficiencies, say about 97% of the time: premature optimization is the root of all evil.” – Donald Knuth
- Before attempting to optimize your own code, you should profile it!
- Typically, most of the runtime is spent in a few functions/subroutines, focus your optimization efforts on those.
- Excellent profiling tools exist, use them!
Profiling
Profilers help you find out where a program is spending its time and pinpoint places where optimising it makes sense. Many different types of profiling tools exist, but for MPI application we need parallel profilers.
Some examples of parallel profilers are:
- Scalasca - a free and open source parallel profiler developed by three German research centers.
- CrayPat - performance analysis tool offered by Cray for the XC platform.
- TAU
- VAMPIR
- Paraver
In this lesson we will use a simple tool called ARM Performance Reports which gives us an overview of how much time is spent in compute, MPI calls and I/O. Performance Reports is part of the ARM Forge (formerly Allinea Forge) suite of tools for parallel applications and is developed by the semiconductor and software design company ARM.
The suite also comes with a debugger (ARM DDT) and a profiler (ARM MAP). ARM MAP is a more advanced tool which allows the user to see how much time each individual line of code takes, and why. ARM DDT supports a wide range of parallel architectures and models, including MPI, UPC, CUDA and OpenMP.
Version 19 and higher of ARM Forge supports Python, in addition to Fortran and C/C++. PDC has a license for ARM MAP and ARM DDT and the most recent versions are installed, but the installed versions of Performance Reports only support Fortran and C/C++. To see which versions are available, type:
$ module avail allinea
Further information
For more information on ARM Forge check the product website. Instructions for how to use ARM Forge at PDC can be found on the support pages.
Performance reports
It is advisable to create a short version of your program, limiting the runtime to a few seconds or minutes. You may be able to reduce the problem size or required precision, as long as this does not change the algorithm itself.
We will use the Poisson solver from the previous lesson as an example. The example program used here (and at the end of the previous section) is here here.
We first load the module for Performance Reports:
module load allinea-reports/18.1.1
Assuming the final version is saved into poisson.c it is compiled with:
mpicc -o poisson poisson.c
Assuming the final version is saved into poisson.F08 it is compiled with:
mpifort -o poisson poisson.F08
Next, we run the executable using Performance Reports to analyse the program execution:
perf-report mpirun -n 16 poisson
This creates two files, one .txt file which can be viewed in the terminal and one .html file which can be opened in a browser.
cat poisson_16p_1n_2019-11-26_09-37.txt
Command:        mpirun -n 16 ./poisson
Resources:      1 node (24 physical, 48 logical cores per node)
Tasks:          16 processes
Machine:        tegner-login-1.pdc.kth.se
Start time:     Tue Nov 26 2019 09:37:22 (UTC+01)
Total time:     1 second
Full path:      /cfs/klemming/nobackup/k/kthw/introduction-to-mpi

Summary: poisson is MPI-bound in this configuration
Compute:                                     35.0% |===|
MPI:                                         65.0% |======|
I/O:                                          0.0% |
This application run was MPI-bound. A breakdown of this time and advice for investigating further is in the MPI section below.

...
The graphical output looks like this:
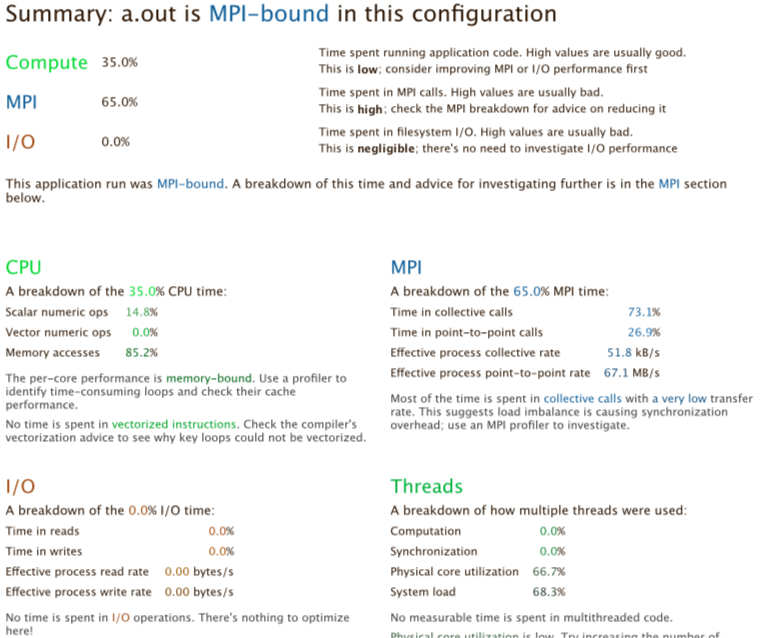
The output shows that when run in this way, the application is MPI bound, i.e. most time is spent in MPI communication. This typically means that the application does not scale well to the given number of processes. Either the number of processes should be decreased, or the problem size increased so that more time is spent in the actual compute sections of the code.
Profile Your Poisson Code
Compile, run and analyse your own MPI version of the poisson code.
- How closely does it match the performance above? What are the main differences?
- Try reducing the number of processes used, rerun and investigate the profile. Is it still MPI-bound?
- Increase the problem size, recompile, rerun and investigate the profile. What has changed now?
Iterative Improvement
In the Poisson code, try changing the location of the calls to
MPI_Send. How does this affect performance?
ARM MAP
After getting a general overview of the performance through ARM Performance Reports, one can start digging deeper using a full-fledged profiler like ARM MAP. We will not go into any details on using MAP, but instead just show how MAP can be used at PDC.
Installing the Remote Client
First, it’s useful to install the ARM Forge Remote Client, as this avoids running the GUI over a possibly slow or unstable ssh connection. The remote client runs on your local computer and can be used to connect to running processes on the cluster.
After downloading an installer for your operating system (link above), you need to set up the connection to PDC:
- Click “Remote Launch”, and select “Configure”
- Click “Add”, and for “hostname” write:
@tegner.pdc.kth.se. You can also give an optional Connection name. - For “Remote installation directory”, enter
/pdc/vol/allinea-forge/19.1.3/amd64_co7/ - Click on “Test Remote Launch” to see if the Remote Client GUI can successfully connect to Tegner.
If connecting fails, you may need to replace the default ssh used by
Remote Client. First create the directory ~/.allinea. In this
directory create a file called remote-exec. In this file, write
#!/bin/sh /correct/path/to/ssh [correct flags] $*
- If you are on OSX with an ssh installed via MacPorts,
the correct ssh would be
/opt/local/bin/ssh - If you have not configured your
~/.ssh/configfile, you will need to add the flagsGSSAPIDelegateCredentials=yes -o GSSAPIKeyExchange=yes -o GSSAPIAuthentication=yes
Profiling with MAP
- First install and configure the ARM Forge Client according to the instructions above.
- Open the Remote Client, click ARM MAP from the left panel, and click “Profile” in the main panel.
- In the window that pops up, select which Application you want to profile and the number of MPI ranks. Tick “Submit to Queue”, and click “Configure” and make sure that the fields look correct. Under “Metrics”, disable Energy, I/O, Lustre.
- Now click “Submit”, and see how a job is launched on Tegner.
Optimisation Workflow
The general workflow for optimising a code, whether parallel or serial is as follows:
- Profile.
- Optimise.
- Test correctness.
- Measure efficiency.
- Goto: 1.
Key Points
Use a profiler to find the most important functions and concentrate on those.
The profiler needs to understand MPI. Your cluster probably has one.
If a lot of time is spent in communication, maybe it can be rearranged.